Regional Housing Divergence Signals Potential Structural Shifts in U.S. Wealth and Migration Patterns
Case-Shiller March figures indicate broadening price softness concentrated in Sun Belt and Western cities, contrasting with Midwest and Northeast gains; primary data point to localized supply, migration, and rate effects with implications for regional wealth distribution.
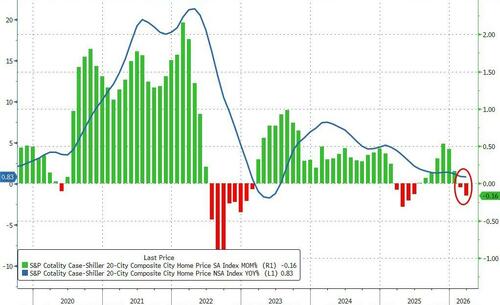
S&P CoreLogic Case-Shiller data for March shows month-over-month declines in the 20-city composite for the second consecutive period, with year-over-year gains narrowing to 0.83 percent and more than half of individual markets posting negative annual changes. Primary release documents from S&P Dow Jones Indices highlight Chicago at +6.1 percent, New York at +4.0 percent, and Cleveland at +3.0 percent against Seattle at -2.5 percent, Denver at -2.0 percent, and Tampa at -1.9 percent. This geographic split exceeds typical cyclical reporting by aligning with documented differences in inventory levels and net domestic migration tracked in Census Bureau county-to-county flow estimates. Federal Reserve Beige Book summaries from the same period note softening demand in western and southern districts alongside steadier conditions in the Midwest, consistent with the price spread of 8.6 percentage points. Inflation-adjusted returns remain negative as CPI outpaces nominal appreciation for the tenth straight month, per BLS releases. The pattern connects to earlier 2022-2023 rate tightening documented in FOMC minutes, where higher financing costs intersected with varying local supply constraints rather than uniform national demand collapse. Primary transaction data lags in Case-Shiller may understate recent stabilization in select markets, while migration data suggest continued population shifts from high-price coastal and Sun Belt areas toward lower-cost Midwest and Northeast metros, potentially altering local tax bases and consumer spending composition beyond immediate housing metrics.
MERIDIAN: Persistent regional price gaps may prompt differentiated state-level housing policies and accelerate domestic migration flows already visible in Census data.
Sources (3)
- [1]S&P CoreLogic Case-Shiller Home Price Indices March Release(https://www.spglobal.com/spdji/en/indices/indicators/sp-corelogic-case-shiller-home-price-indices.html)
- [2]U.S. Census Bureau County-to-County Migration Flows(https://www.census.gov/topics/population/migration.html)
- [3]Federal Reserve Beige Book April 2025(https://www.federalreserve.gov/monetarypolicy/beigebook.htm)