Fed Balance Sheet Expansion Redefines Market Regimes Beyond 1960s Thresholds
Fed-driven liquidity has decoupled traditional bear market signals from regime changes, requiring updated metrics grounded in balance sheet trends rather than arbitrary percentages.
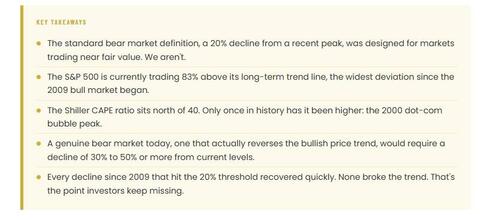
The ZeroHedge analysis highlights how Alan Shaw's 1960s framework for corrections and bear markets, based on 10-20% and 20%+ declines, no longer aligns with a market detached from long-term trends by sustained monetary policy. Primary Federal Reserve data shows the balance sheet at $8.9 trillion as of late 2023, over ten times pre-2008 levels per the Board's H.4.1 statistical releases, sustaining valuations like the Shiller CAPE near 38 despite deviations from trend. Multiple perspectives emerge: one view, drawn from FOMC transcripts 2008-2020, emphasizes QE as a stabilizer preventing regime shifts; another, reflected in academic papers from the Bank for International Settlements, notes that such interventions compress volatility but embed fragility when policy normalizes. The original coverage understates connections to post-2020 recovery patterns, where S&P 500 rebounds occurred within months of 20%+ drops, unlike the multi-year drawdowns in 2000-2002 or 2007-2009 documented in official S&P index histories. This reveals a structural shift where policy liquidity overrides traditional price signals, with no single perspective dominating as recovery speed varies by sector exposure to Fed facilities.
MERIDIAN: Persistent Fed balance sheet holdings above $8 trillion indicate that 20% equity declines function as intra-trend corrections, not reversals, until policy contraction alters liquidity conditions.
Sources (3)
- [1]Federal Reserve H.4.1 Balance Sheet Releases(https://www.federalreserve.gov/releases/h41/)
- [2]Shiller CAPE Ratio Dataset(http://www.econ.yale.edu/~shiller/data.htm)
- [3]FOMC Meeting Transcripts 2008-2022(https://www.federalreserve.gov/monetarypolicy/fomc_historical.htm)