US Housing Market Shows Consecutive Monthly Declines Amid Persistent Real Wealth Erosion
Corroborated Case-Shiller April 2026 data shows third MoM decline in major metros with ongoing real wealth erosion tied to inflation and rates; regional splits and affordability constraints point to a deeper correction.
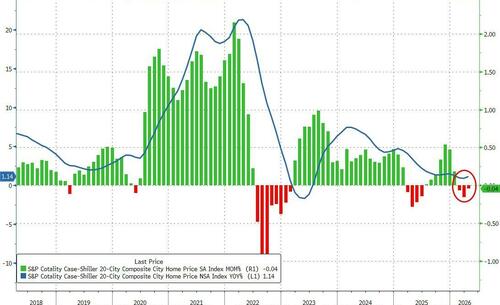
Recent S&P Cotality Case-Shiller data for April 2026 confirms the third consecutive month-over-month decline in the 20-city composite home price index, albeit a modest 0.04% drop that fell short of the 0.10% expectation. Year-over-year growth ticked up slightly to 1.14%, yet this masks underlying softness in nominal terms and outright declines when adjusted for inflation, which reached 3.8% in April.
This marks the 11th straight month of real-term erosion in housing wealth, as official figures show consumer prices outpacing home appreciation. The pattern aligns with elevated 30-year mortgage rates around 6.3%, constraining affordability and transaction volumes. Regional disparities are stark: Midwest and Northeast markets like Chicago (+6.5% YoY), New York (+3.8%), and Cleveland (+3.2%) continue moderate gains, while Sun Belt and Western metros such as Seattle (-2.3%), Denver (-1.8%), Tampa (-1.8%), Dallas (-1.6%), and Phoenix (-1.7%) post notable annual declines.
These consecutive monthly softness signals extend beyond headline statistics into broader wealth effects. With housing representing a primary store of household wealth, sustained real declines compound pressures from higher borrowing costs and inflation, potentially dampening consumer spending via reduced equity extraction. Official releases and market analyses note this cooling reflects a shift from pandemic-era surges to a more localized, fundamentals-driven market, with geographic dispersion highlighting vulnerabilities in high-cost coastal and Sun Belt areas previously buoyed by migration.
Connections to monetary policy remain tight: rate paths influence financing costs directly, while inflation metrics determine whether nominal stability equates to real losses. Data from FRED and S&P indices illustrate how this dynamic has persisted across multiple releases, suggesting the correction may have legs if rates stay elevated.
Market Analyst: Persistent real declines could further suppress housing turnover and equity-driven consumption, amplifying sensitivity to any Fed rate adjustments in 2026.
Sources (4)
- [1]Trading Economics Case-Shiller 20-City Index April 2026(https://tradingeconomics.com/united-states/case-shiller-home-price-index-yoy)
- [2]FRED S&P Cotality Case-Shiller U.S. National Home Price Index(https://fred.stlouisfed.org/series/CSUSHPINSA)
- [3]Advisor Perspectives S&P Cotality Case-Shiller Housing Slowdown Analysis (March context)(https://www.advisorperspectives.com/dshort/updates/2026/05/26/s-p-cotality-case-shiller-index-housing-slowdown-intensifies)
- [4]S&P Global Cotality Case-Shiller Indices Overview(https://www.spglobal.com/spdji/en/index-family/indicators/sp-cotality-case-shiller/sp-cotality-case-shiller-composite/)