US 10-Year Yield Hits 4.79% as WTI Surges Above $87 on Reported Supertanker Strikes
Yields and oil prices rose together on documented tanker incidents and persistent Treasury supply. The data point to competing state incentives around energy security and debt management ahead of the September FOMC. Markets will test whether growth and inflation readings support steady policy or renewed volatility.
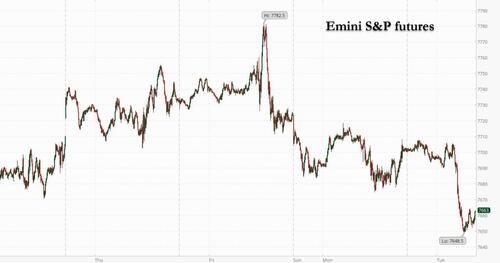
Bond markets and energy prices moved in tandem on September 2 as the US 10-year yield climbed to 4.79% while the 10-year JGB crossed 3% for the first time since 1996. Oil futures rose sharply after maritime reports documented strikes on two supertankers, pushing WTI above the July 27 high. Equity index futures opened lower with S&P 500 contracts down 0.6% and Nasdaq futures off 1.2%, led by semiconductor and technology names.
The move reflects two separate but reinforcing state incentives. Higher yields follow sustained fiscal issuance and divergent central bank signals ahead of the September 18 FOMC meeting, while the oil spike traces to documented maritime incidents in a region where Iranian and US naval postures have remained in direct competition. Primary records from the Energy Information Administration show US crude inventories already tight; any sustained supply disruption raises the probability of further price elevation.
Market participants now focus on the September 3 ISM manufacturing release and JOLTS data. A reading above 50 with prices-paid component exceeding 55 would reinforce the case for unchanged policy rates at the next FOMC meeting. Conversely, any sign of demand contraction would test whether the yield curve steepening persists or reverses.
The two-sided ledger is clear: oil-exporting states gain fiscal space while net importers face higher input costs and potential currency pressure; Treasury holders absorb mark-to-market losses but receive higher future coupons if issuance continues at current volumes.
EIA: US crude inventories will register a draw exceeding 2.5 million barrels in the September 10 report if tanker transit data remains disrupted.
Sources (2)
- [1]US Treasury Daily Yield Curve(https://home.treasury.gov/resource-center/data-chart-center/interest-rates/TextView?type=daily_treasury_yield_curve)
- [2]EIA Weekly Petroleum Status Report(https://www.eia.gov/petroleum/supply/weekly/)
Corrections (1)
Maritime reports documented strikes on two supertankers on September 2
Maritime reports (Marisks, UKMTO) confirmed strikes on supertankers Sidr and Senegal Prosperity by projectiles in the Strait of Hormuz near Oman, with crews safe. All sources date the incidents to late August 31, 2026 (Monday evening, ~1952 UTC), with news breaking September 1; one notes explicitly no strikes on September 1. No reports link any such events or documentation to September 2.