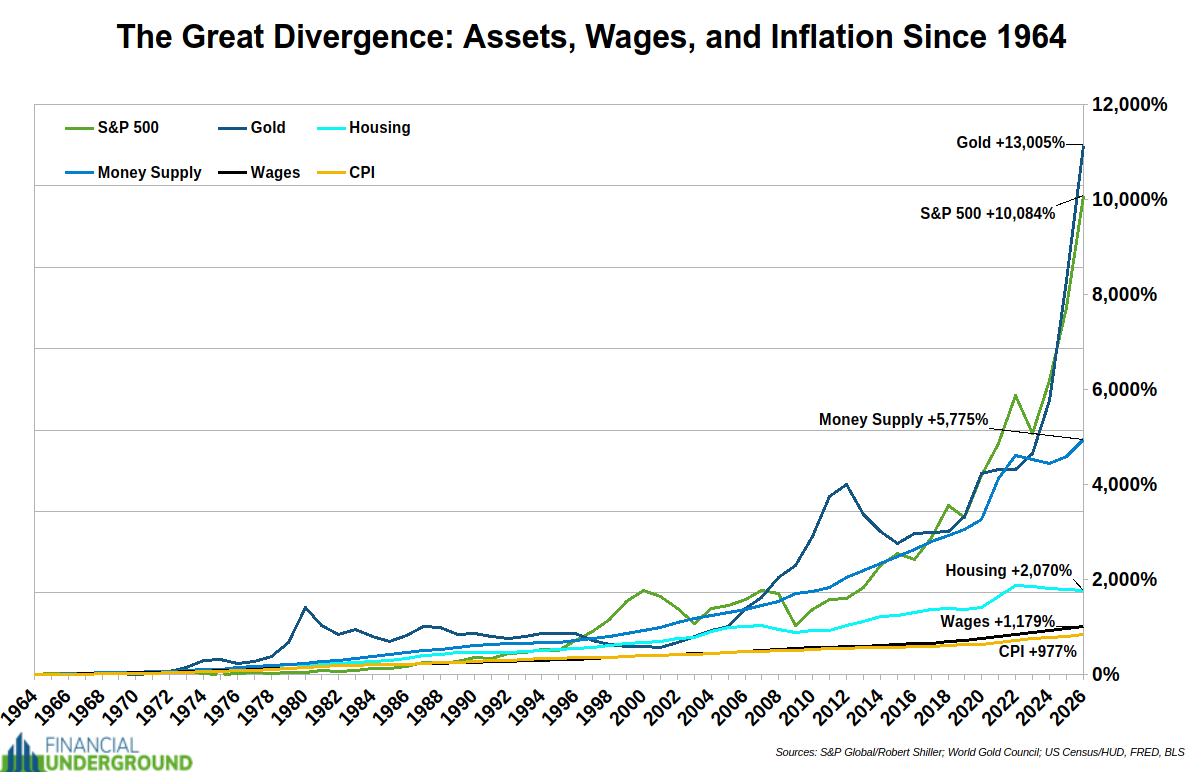
The Great Wealth Divide: How Monetary Expansion Entrenches Asset Owners Over Wage Earners
Monetary expansion via M2 growth since the mid-20th century has widened the wealth gap by rewarding asset ownership over wage labor, backed by Fed data, Cantillon effect studies, and performance comparisons across gold, equities, housing, and earnings.
The original analysis from International Man highlights a persistent pattern: since the 1960s, broad money supply (M2) growth has vastly outpaced official CPI inflation and median wages, with gold and equities delivering superior returns while housing and labor income lag. This dynamic, rooted in repeated episodes of currency debasement tied to government spending and Federal Reserve policy, creates a structural advantage for those holding inflation-resistant assets.
Corroborating data from Federal Reserve sources and independent analyses confirm the scale. M2 has expanded dramatically—roughly 80-fold since 1959—while CPI rose about 8-11 times and production/nonsupervisory earnings grew more modestly.[1][2] Gold's long-term outperformance relative to housing and wages aligns with historical records, particularly post-2000 and amid recent monetary surges.[3]
This reflects the Cantillon effect: new money enters the economy unevenly, first benefiting asset holders (stocks, real estate, commodities) before wages adjust. Mises Institute examinations of post-1971 data show rising inequality metrics, including Gini coefficients and top-percentile net worth shares, correlating tightly with M2 expansions, especially after 2008 and 2020 QE rounds.[4][5] Recent Federal Reserve household net worth figures—reaching nearly $196 trillion by mid-2026—underscore how equity appreciation disproportionately accrues to the top decile, even as employee compensation as a share of GDP hits historic lows.[6]
Deeper connections emerge in policy and political spheres. The wealth effect from elevated asset prices sustains demand in services and housing but exacerbates generational and class divides, fueling debates over socialism among younger cohorts reliant on wages. FT analysis notes this K-shaped recovery dynamic, where monetary tools lose traction amid skewed ownership.[6] CEPR research on asset demand outstripping supply due to demographics and inequality further illustrates how fiscal-monetary interplay locks in these trends.[7] Unlike pure wage-focused inequality narratives, this lens reveals monetary institutions as amplifiers rather than neutral arbiters.
In practice, the divide compounds: asset owners compound gains via capital appreciation tied to liquidity expansion, while wage earners face eroding purchasing power masked by CPI methodology. Historical inflection points (1933, 1971, 2008, 2020) ratchet the process higher, with gold serving as a consistent benchmark of debasement.
Sources (6)
- [1]Four Charts That Show Cantillon Effects(https://mises.org/mises-wire/four-charts-show-cantillon-effects)
- [2]How Monetary Expansion Creates Income and Wealth Inequality(https://mises.org/mises-wire/how-monetary-expansion-creates-income-and-wealth-inequality)
- [3]High asset prices, not low interest rates, are driving inflation(https://www.ft.com/content/7a9f5756-bf18-4a42-80d1-653c955447aa)
- [4]The Million-Dollar Economy: Wealth, Inflation & 2037(https://patternnexus.com/million-dollar-economy-1980-2037)
- [5]DP20813 The Race between Asset Supply and Asset Demand(https://cepr.org/publications/dp20813)
- [6]M2 Money Supply Chart: US Money Printing Since 1959(https://outsmartmoney.ai/money-supply/)