Six States Generate 44.7 Percent of U.S. GDP While Population and Fiscal Flows Shift South and West
BEA data reveal extreme geographic concentration of U.S. output alongside measurable population and capital relocation from high-tax, high-regulation states to lower-cost jurisdictions. These shifts alter federal revenue incidence and future apportionment without corresponding changes in stated national growth policy.
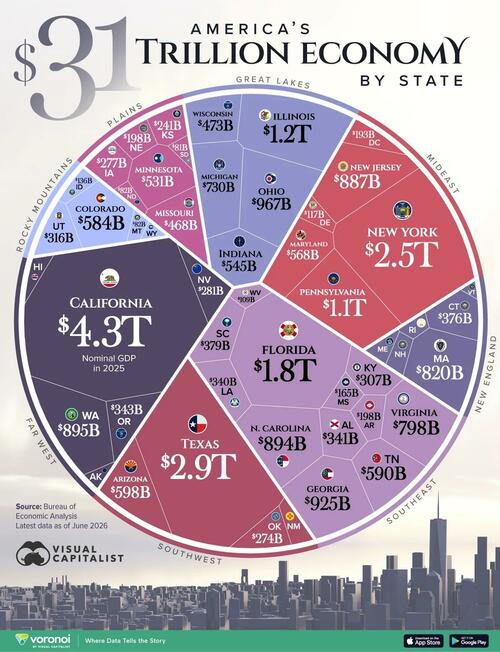
BEA state GDP data through 2025 show output remains heavily concentrated in six jurisdictions whose combined economies exceed $13.8 trillion. California alone matches the scale of Germany, yet its share of national population is only 11.7 percent. Texas and Florida post faster nominal growth rates than the Northeast corridor, reflecting energy, defense, and logistics expansion rather than stated policy goals of balanced regional development. IRS migration statistics for tax years 2022-2024 document net domestic outflows from California and New York exceeding 300,000 filers annually, with Florida and Texas as primary destinations, altering the distribution of federal payroll and income tax receipts.
High-output coastal states maintain elevated per-capita tax burdens and regulatory overhead that coincide with sustained out-migration of working-age households and firms. Interior and Sun Belt states gain population and capital stock without equivalent increases in federal transfer obligations, widening the gap between GDP contribution and fiscal draw. BEA industry breakdowns confirm Texas diversification across energy, manufacturing, and agriculture reduces single-sector exposure compared with Nevada or Hawaii tourism dependence.
Quarterly BEA revisions scheduled for 2026 will incorporate updated capital expenditure and trade data that test whether Texas GDP share crosses 10 percent. Sustained migration differentials recorded by Census population estimates will shift House apportionment and Electoral College weights after the 2030 census, directly affecting federal spending formulas tied to state-level economic metrics.
BEA: Texas nominal GDP exceeds $3.2 trillion in 2026 annual revision, narrowing the gap with New York below $300 billion.
Sources (2)
- [1]Primary Source(https://www.bea.gov/data/gdp/gdp-state)
- [2]Supporting Source(https://www.irs.gov/statistics/soi-tax-stats-migration-data)