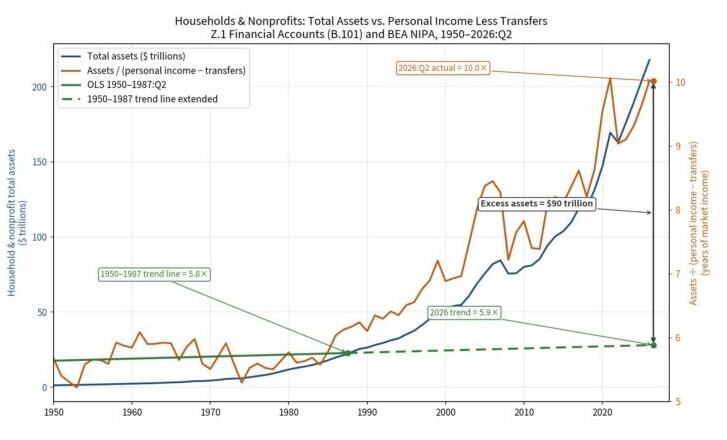
Fed Policies and the Divergence of Household Assets from Income: Examining the Data on Wealth Inflation and Inequality
Stockman's piece on Fed-driven asset inflation is largely consistent with official data trends on rising net worth-to-income ratios, declining savings rates, and wealth concentration since the late 1980s, though specific extrapolations warrant scrutiny against primary Fed sources.
David Stockman's analysis highlights a post-1987 acceleration in the ratio of U.S. household assets to earned income, rising from around 5.8x to 10x by mid-2026, attributing the gap to Federal Reserve monetary policies that inflated asset values faster than underlying income growth. Federal Reserve data supports the broader trend of rising household net worth relative to disposable personal income, with the ratio climbing from historical averages near 5x in the 1980s to record levels exceeding 6.5x in recent years, driven by gains in equities, real estate, and other financial assets.[1][2]
Savings rates provide additional context: personal saving as a share of disposable income averaged over 11% in the 1960s-1970s but has since declined to around 4-6% in recent years, consistent with the article's depiction of stagnant real savings growth amid asset appreciation.[3] Official Flow of Funds and Distributional Financial Accounts data confirm substantial aggregate net worth growth since 1989, with the top 1% capturing a disproportionate share of gains—rising to roughly 30% of total household wealth—while the bottom 50% holds about 2.5-5%, aligning directionally with claims of skewed distribution.[4][5]
St. Louis Fed analysis further shows assets-to-income ratios for older households more than doubling since the 1950s, underscoring intergenerational and policy-driven shifts.[6] While exact figures like $90 trillion in 'excess' assets or precise 3%/32% splits originate from the commentary, the underlying patterns of asset inflation outpacing wage/income growth and concentrated wealth gains are corroborated across multiple Fed releases and independent reviews. These dynamics raise questions about sustainability, as elevated valuations relative to income have preceded corrections in prior cycles.
Fed DFA and FRED data: Asset-to-income divergence and top-heavy gains persist unless monetary policy shifts, amplifying risks of uneven corrections across wealth cohorts.
Sources (5)
- [1]Is household wealth overvalued? | FRED Blog(https://fred.stlouisfed.org/blog/2019/08/is-household-wealth-overvalued)
- [2]Valuation Ratios for Households and Businesses | San Francisco Fed(https://www.frbsf.org/research-and-insights/publications/economic-letter/2018/01/valuation-ratios-for-households-and-businesses/)
- [3]Assets and Liabilities of Younger vs. Older Households | St. Louis Fed(https://www.stlouisfed.org/on-the-economy/2024/feb/assets-and-liabilities-of-younger-vs-older-households)
- [4]Americans aren't saving as much as they used to | USAFacts(https://usafacts.org/articles/why-arent-americans-saving-as-much-as-they-used-to/)
- [5]Distribution of Household Wealth in the U.S. since 1989 | Federal Reserve(https://www.federalreserve.gov/releases/z1/dataviz/dfa/distribute/table/)