K-Shaped Economy: Documented Wage Compression and Spending Divergence Amid Persistent Inflation Pressures
Corroborated evidence supports elements of the K-shaped economy in wages (pandemic compression followed by 2025 reversal at the bottom), spending (high-income driven since 2023), and inflation's lasting impact, with credible sources from Fed banks, EPI, and NBER analyses; claims of extreme exaggeration in spending shares and permanent rifts are tempered by recent convergence signals.
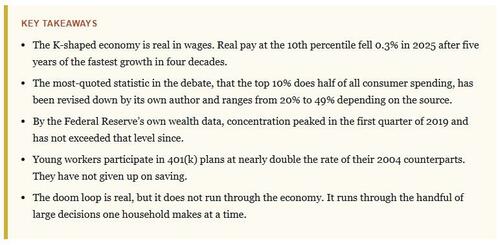
The K-shaped economy narrative captures real divergences in recent U.S. economic outcomes, particularly in wages and consumer spending, though many headline claims overstate the novelty or permanence of the divide. A 2023 NBER paper by David Autor, Arindrajit Dube, and Annie McGrew documented an 'unexpected compression' in the wage distribution during the tight post-pandemic labor market, with rapid relative gains at the bottom reversing roughly one-third of four decades of rising 90/10 wage inequality.[1][2]
Economic Policy Institute analysis of CPS data shows this compression reversed in 2025: real wages at the 10th percentile fell 0.3% while the median rose 0.8%.[3] Cleveland Fed data indicate that from early 2020 through mid-2025, real wages at the 10th percentile grew 9.7% versus 4.5% at the 90th, though absolute dollar gains remained larger at higher percentiles.[4] Cumulative CPI inflation since December 2019 stands at approximately 26-30%, imposing a lasting cost-of-living shift that disproportionately affects asset-poor households.[5][6]
Federal Reserve Bank of New York research confirms K-shaped spending patterns since 2023, with high-income households (above $125k) driving most real retail spending growth (around 7.6% cumulative) while lower-income groups saw minimal gains (~1%).[2][7] Wealth data from the Fed's Distributional Financial Accounts show the bottom 50% share of net worth rising to about 2.5% from lower pre-pandemic levels, though concentration at the top remains elevated.[8]
These patterns extend beyond aggregates to social and political fault lines. Uneven recovery amplifies perceptions of systemic unfairness, fueling debates over policy responses like labor market interventions or targeted relief. Recent data suggest some narrowing in wage and spending gaps by mid-2026, yet the structural imprint of inflation and asset-driven wealth gains continues to shape household experiences differently across income strata. The divide is neither entirely new nor purely media-driven; it reflects measurable heterogeneity in how macroeconomic shifts transmit to different segments of the population.
Fed analysts: Persistent K-dynamics in spending and wealth could sustain political polarization around inequality and affordability into 2027, even as aggregate growth masks household-level strains.
Sources (6)
- [1]K-Shaped Economy: Reality Or Media-Driven Perception(https://seekingalpha.com/article/4947892-k-shaped-economy-reality-media-driven-perception)
- [2]The Unexpected Compression: Competition at Work in the Low Wage Labor Market(https://papers.ssrn.com/sol3/papers.cfm?abstract_id=4379043)
- [3]Tracking the K-Shaped Economy: Who’s Driving Spending?(https://libertystreeteconomics.newyorkfed.org/2026/05/tracking-the-k-shaped-economy-whos-driving-spending/)
- [4]Low-wage workers faced worsening affordability in 2025 as wage growth stalled(https://www.epi.org/blog/low-wage-workers-faced-worsening-affordability-in-2025/)
- [5]New research confirms U.S. economy's K-shaped dynamics(https://www.axios.com/2026/05/01/us-economy-spending-growth-income)
- [6]U.S. consumer prices up 30% since 2019(https://qz.com/consumer-prices-inflation-30-percent-2019-091126)